
On your computer
Run a model on your computer with Ollama or LM Studio. The data used in that analysis stays on your computer.
Review forex and gold charts with Red Candle. See market structure and levels from your MT5 candles, then get an explanation from your local or cloud AI.
Read the AI Analysis guide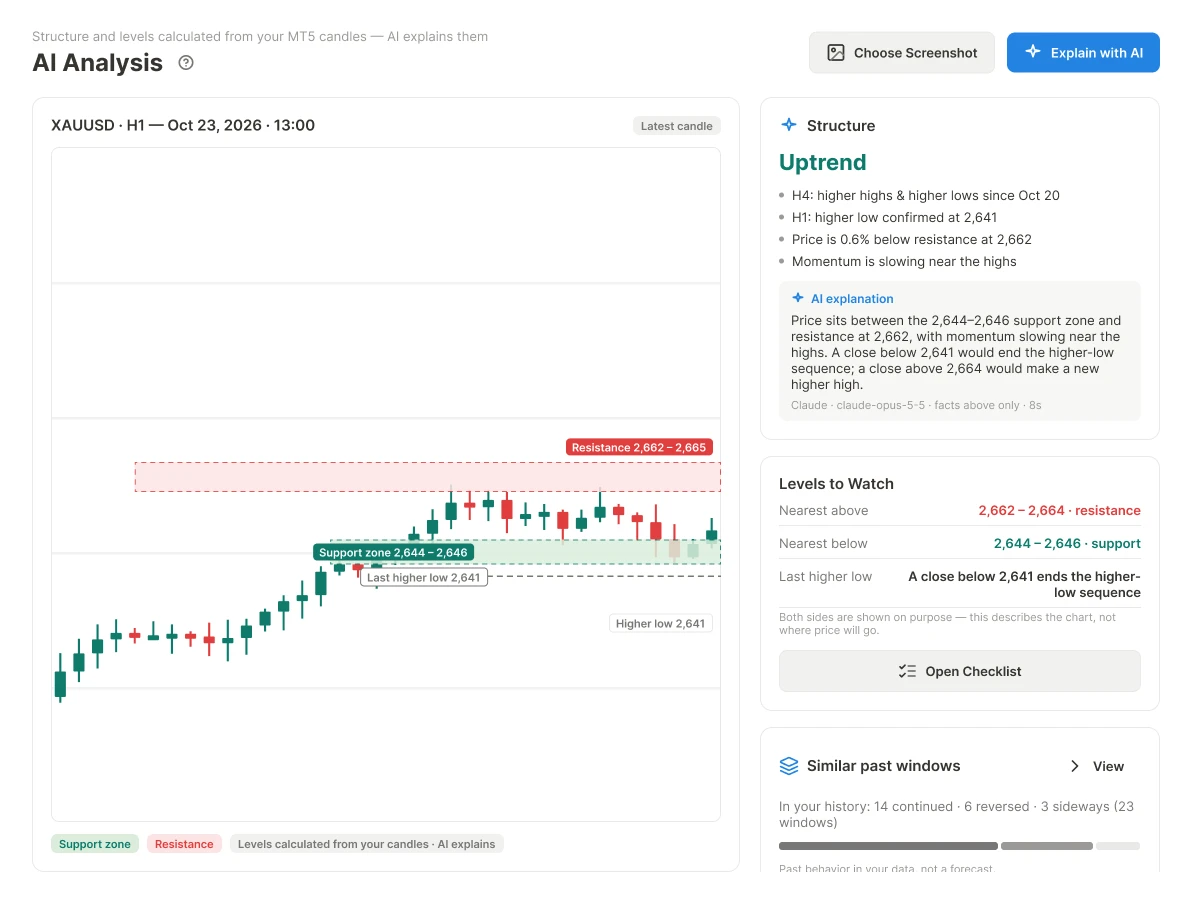
In this example, the app identifies an uptrend and shows support at 2,644–2,646 and resistance above price. The AI explains what those levels mean and why a close below 2,641 would end the higher-low sequence. Compare the explanation with the measured levels before saving your observations in the journal.
Import your MT5 candles, then review the latest candle or choose a past Timeline screenshot. Red Candle calculates market structure and levels even before you connect an AI provider. The explanation describes the chart and leaves trading decisions to you.
Run a model on your computer with Ollama or LM Studio. The data used in that analysis stays on your computer.
Use your own API key for ChatGPT, Gemini, Claude or a compatible provider. When you request analysis, Red Candle sends the inputs needed for that request to the provider you selected.