
How to Use Similar Patterns the Right Way
Set up Similar Patterns in Red Candle, choose settings that fit how you trade, and read matches, outcomes and drawdown without overreading them.
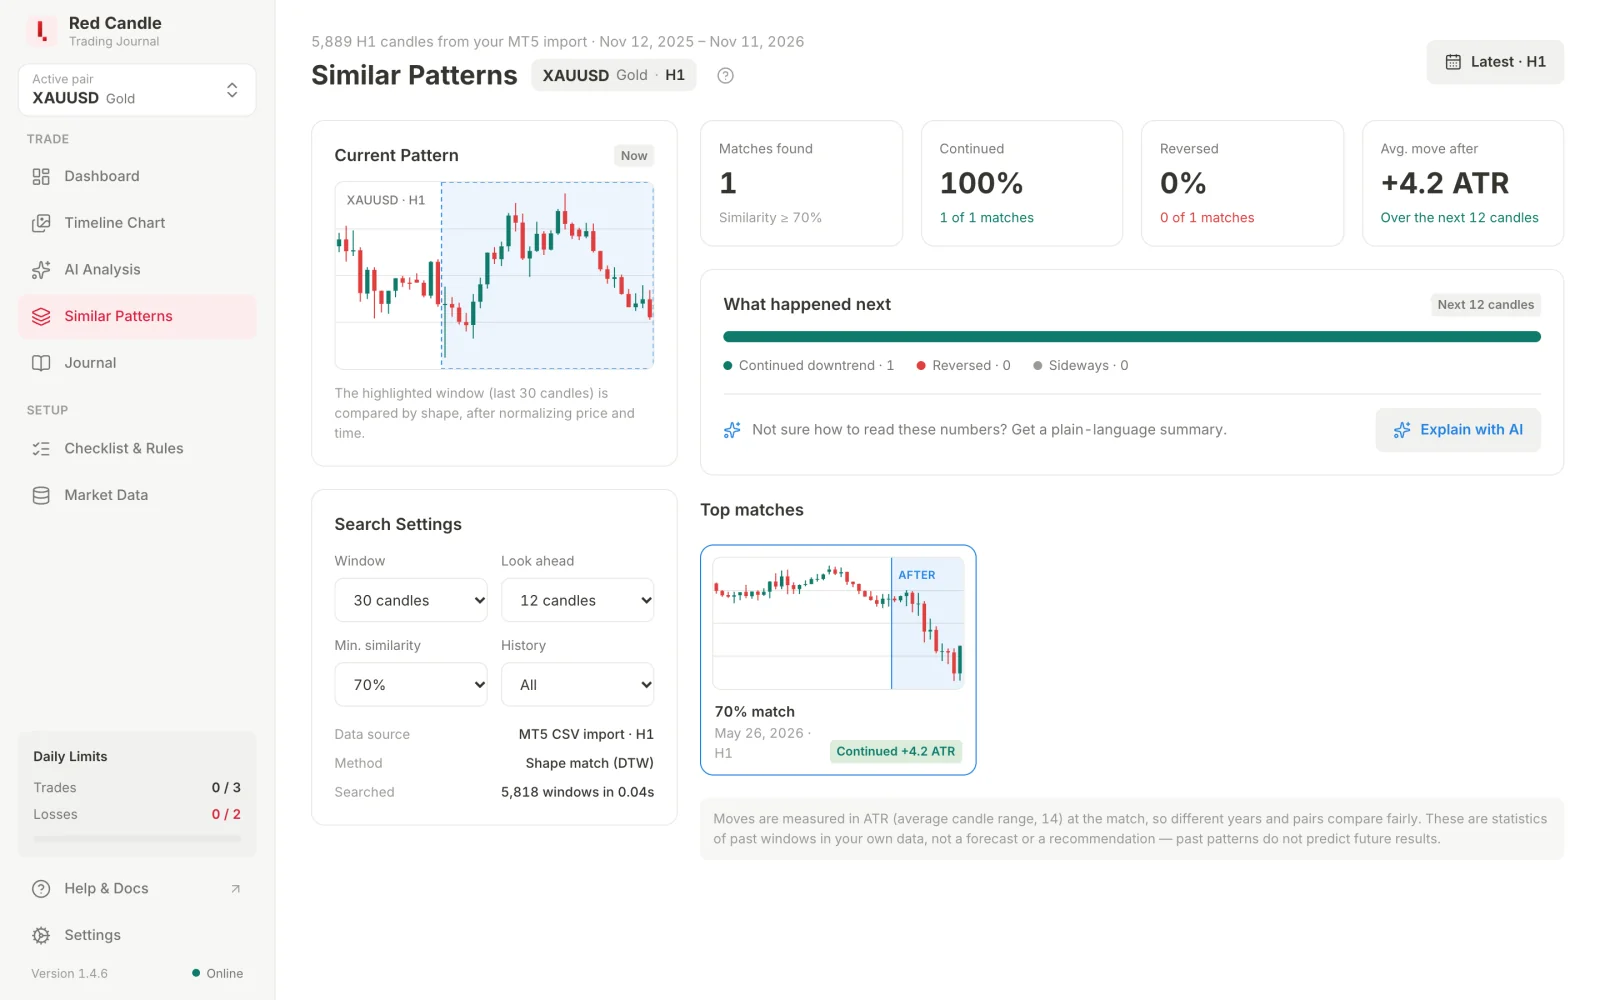
Similar Patterns answers one question: when the chart in my own data looked like this before, what happened over the next few candles? It compares the latest candles of the active pair with your imported MT5 history and shows how the closest past windows turned out.
The answer is a set of statistics from the past. It can show you how often a shape continued or reversed, and how far price usually moved. It does not tell you what will happen next. Used with that in mind, it is a useful second look before you run your pre-trade checklist.
Prepare your data before you search
The search can only be as good as the candles behind it.
- Import enough history. The app needs at least 300 candles of one timeframe (M15, M30, H1, H4 or D1) before it can search. That is the minimum. More history gives the search more past windows to compare, so a few years of H1 or M15 candles usually give more matches than a few months. See how to export candles from MetaTrader 5.
- Pick one pair. With "All pairs" active there is no single chart to compare. Choose the pair in the sidebar first.
- Check the broker time zone. Session labels and the dates of matches depend on it. If the times look shifted, see broker time.
- Search the timeframe you trade. Greyed-out timeframes don't have 300 candles yet. Import them in Market Data rather than switching to a timeframe you don't use.
Choose settings that fit your question
Open Search Settings. The defaults are a window of 30 candles, a look ahead of 12 candles and a minimum similarity of 80%. They are a reasonable start. Change them only when you know why.
| Setting | What it controls | How to choose |
|---|---|---|
| Window (20, 30, 50) | How many recent candles form the current pattern | Match the length of the setup you look at on the chart. 20 for a short move, 50 for a longer structure. |
| Look ahead (6, 12, 24) | How many candles after each match are measured | Match how long you usually hold a trade on that timeframe. On H1, 12 candles is about half a day. |
| Min. similarity (70% to 90%) | How close a past window must be to count | Higher gives fewer, closer matches. Lower gives more matches that look less alike. |
| History | All, Last year or Last 6 months | All gives the largest sample. Use a shorter period when you think the market behaves differently now. |
Decide your settings before you look at the results. If you keep changing them until the numbers agree with the trade you already wanted, the search only repeats your opinion back to you.
Read the results in order
Click Search and read the panels from left to right.
1. Matches found. Start with the sample size. Overlapping windows describe the same moment, so the app keeps only the best match from each cluster. Five matches can only show you a few examples. With dozens of matches, the split between outcomes is more stable. If no window reaches your minimum, the app suggests a lower minimum or a longer history.
2. Continued, Reversed and Sideways. The direction comes from the current window: if it rose from its first to its last close, "continued" means price kept rising. A move of 0.5 ATR or more in that direction at the end of the look ahead counts as Continued. The same move against it counts as Reversed. Anything smaller is Sideways. A large sideways share is useful information: it says this shape often led nowhere in particular.
3. Avg. move after. This is the average close-to-close move over the look ahead, measured in ATR (the average range of 14 candles at each match). ATR lets matches from quiet and busy years be compared fairly. To turn it into price, multiply by the current ATR on your chart.
4. Top matches. Open a match to see Now and Then side by side. Look at three numbers:
- Move after match: where price closed at the end of the look ahead.
- Best point reached: the furthest price went in the window's direction, and after how many candles.
- Max drawdown: the furthest price went against that direction before the end.
The last two are often more useful than the average. A match that ended up 1 ATR higher may have gone 1.5 ATR against the direction first. Compare that with the stop distance in your own plan.
Why it matches shows the parts of the score: shape, trend slope, volatility and session. If the current window is in the London session and most matches are from Asia, keep that in mind. Your journal that day shows any trades you logged on that pair that day, so you can see how you traded a similar chart before.
Test the search on past moments
Search from sets the candle where the window ends. Pick a past time where you already know what happened, run the search, and compare its statistics with the real outcome. Do this for several moments on your pair and timeframe. You learn how well the statistics described the next candles in your own data, before you rely on them.
The test is fair: a historical match and its measured outcome must finish before the searched window starts, so no future candles leak into the result. Click Use latest candle to return to the present.
Use AI for a plain summary
Explain with AI writes a neutral summary of the search statistics. It uses the numbers only; no screenshots are sent. It describes how past windows turned out and doesn't call a direction. It helps when the numbers are hard to read, and the numbers on screen remain the source to check against. To connect a provider, see the AI Analysis guide.
Avoid these common mistakes
- Reading similarity as a win rate. An 85% match means the shape is close. It says nothing about the chance that a trade is profitable.
- Trusting a small sample. With only a few matches, one unusual week can change the whole split.
- Lowering the minimum to get more matches. At 70% the windows may look quite different from yours. Prefer a longer history first.
- Ignoring drawdown. The average move hides how far price moved against the direction on the way.
- Using a look ahead that doesn't fit your trades. Measuring 24 candles tells you little about a trade you close after 6.
Add it to your routine
Run the search before your pre-trade checklist, not after you have entered. Write what you saw in the trade's notes, for example: "32 matches, 14 continued, 9 reversed, max drawdown often near 1 ATR." When you review the week, compare those notes with what happened and with how you followed your plan. Over time this shows whether the search helps your decisions on that pair, and it keeps the final decision with your own rules. The win rate vs. risk:reward article explains why the size of moves matters as much as how often they go your way.
Key takeaways
- Import enough history for the timeframe you trade, and search one pair at a time.
- Set the window to the length of your setup and the look ahead to your usual holding time, before you see results.
- Read the sample size first, then the outcome split, then best point and max drawdown in the top matches.
- Test the search on past moments with Search from to see how it worked on your own data.
- Treat every result as statistics of the past, not a forecast or a signal.
Try it in Red Candle
Keep your checklist, daily limits and trading journal together on your computer.
Download AppContinue in the docs
Similar Patterns →Import candles →Broker server time →ⓘ Educational content, not financial advice. Trading involves risk, and past results don't guarantee future results.
Related articles

How to Use AI Analysis in Your Trading Journal
What AI Analysis in Red Candle does well, how to set it up, and how to read structure, levels and the AI explanation step by step.
Read article →How to export candles from MetaTrader 5
How to use Export Bars in MT5, which timeframes to choose, how much history you need, and why broker server time matters.
Read article →
AI Forex Chart Review for Your Trading Journal
Review an MT5 chart with AI, check the explanation against the candles, and record your own observations in a trading journal.
Read article →