
How to Use AI Analysis in Your Trading Journal
What AI Analysis in Red Candle does well, how to set it up, and how to read structure, levels and the AI explanation step by step.
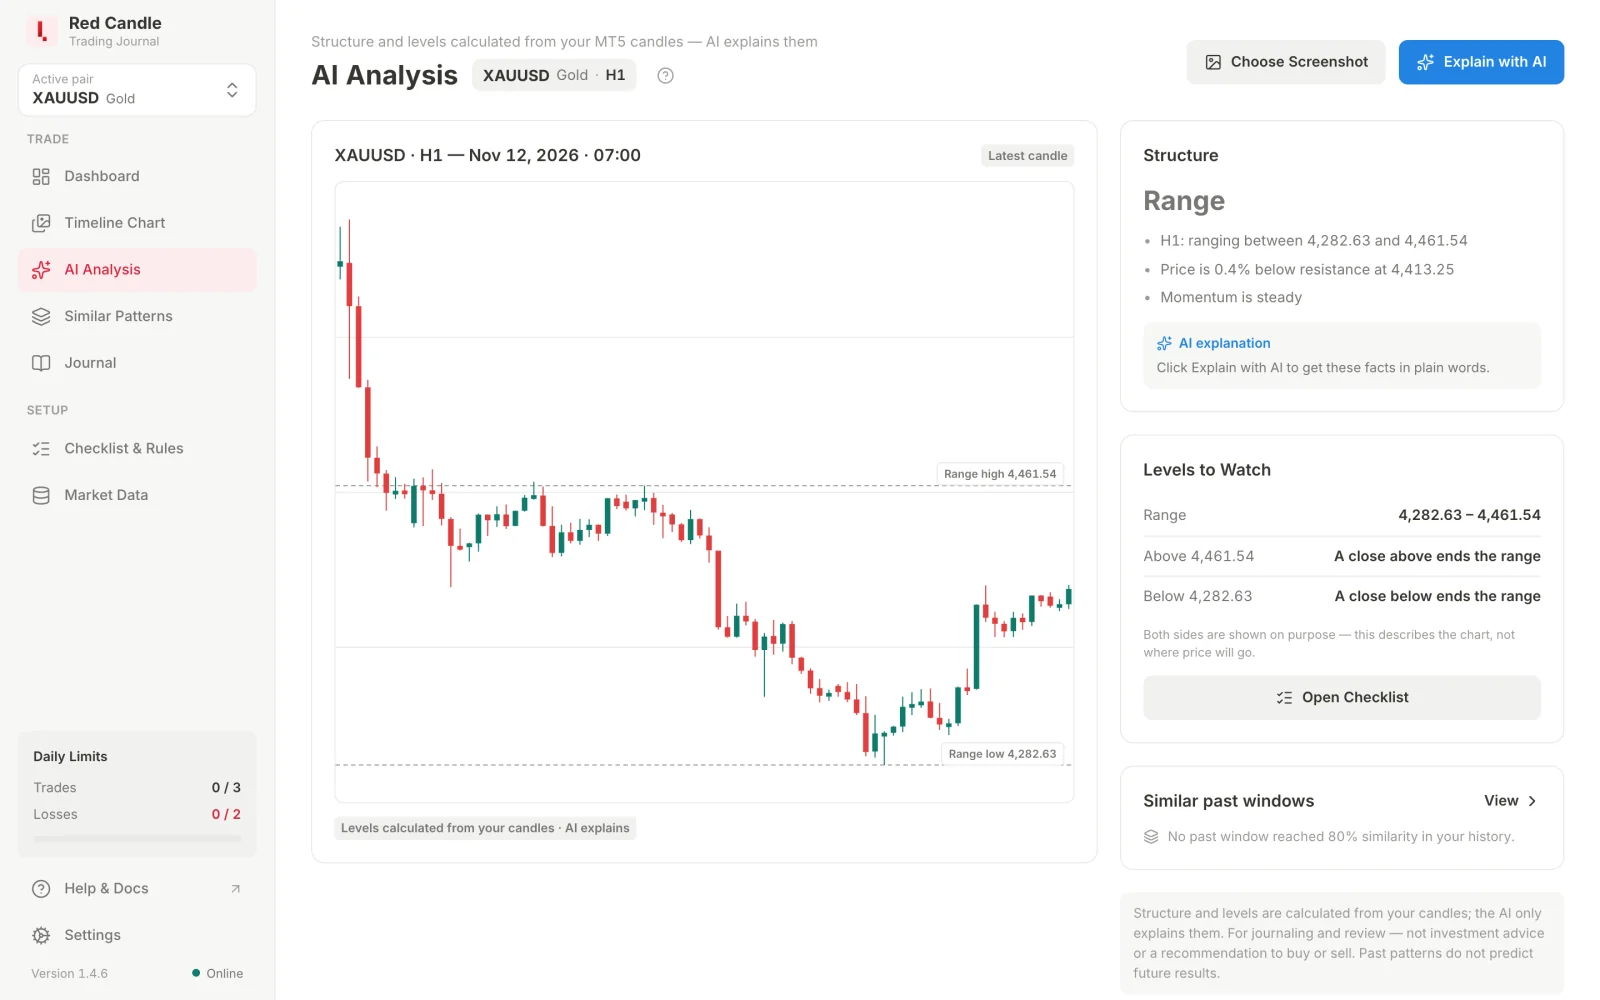
AI Analysis describes the chart of one pair from your own MT5 candles: the structure (uptrend, downtrend or range), the nearest support and resistance, and the swing that would change the structure. Red Candle calculates all of that itself. The AI only puts those facts into plain words when you ask it to.
This guide explains why it is built that way, how to set it up, and how to read each part of the screen.
What makes AI Analysis different
Many AI chart tools send a picture of a chart to a language model and let it name the trend and the levels. A model can misread a price axis or invent a level that isn't there. AI Analysis works in a different order.
- The numbers come from your candles. Trend, support zones, resistance and swing points are measured from the MT5 candles you imported. The AI receives those measurements and explains them. It does not choose the levels.
- It works without any AI. Structure, Levels to Watch and Similar past windows are all calculated on your computer. Connecting an AI only adds the plain-language explanation.
- It shows both sides. Levels to Watch always lists the nearest level above and below price. The screen describes the chart. It doesn't say which way price will go, and the AI is instructed not to either.
- It can read a past moment. With Choose Screenshot you can read the chart at the time of a Timeline screenshot, which makes a trade review more honest than reading today's chart.
- You choose the AI and what leaves your computer. Use a local model with Ollama or LM Studio, or your own key for ChatGPT, Gemini, Claude or a compatible provider. On this screen, Explain with AI sends only the measured facts as text. No screenshots are sent.
- It connects to the rest of your routine. Similar past windows opens in Similar Patterns, and Open Checklist takes you to your pre-trade checklist.
Prepare your candles
AI Analysis reads the candles you imported, so start there.
- Import H1 and H4. H1 plus H4 gives the best read: the higher timeframe adds context, such as "H4: higher highs & higher lows", to the main one. See how to export candles from MetaTrader 5 and import candles.
- Pick one pair. With All pairs active there's no single chart to read. Choose the pair in the sidebar.
- Keep your candles current. The read starts from the latest candle you imported. If your last import was last week, the analysis describes last week.
Read the screen from top to bottom
Open AI Analysis in the sidebar. By default it reads from the Latest candle.
1. The chart
The chart marks the nearest Support zone, the Resistance, and the swing that defines the structure, for example "Last higher low 2,641". Check that the marked levels match what you see on your own chart before you read further.
2. Structure
Structure shows Uptrend, Downtrend or Range and the facts behind it, for example:
- "H4: higher highs & higher lows since Oct 20"
- "Price is 0.4% below resistance at 2,665"
- "Momentum is slowing — recent candles are smaller"
Read the facts, not only the label. An uptrend with slowing momentum just below resistance describes a different chart than an uptrend in the middle of its range.
3. Levels to Watch
Levels to Watch lists Nearest above and Nearest below. In a trend it adds the Last higher low or Last lower high, with a note such as "A close below 2,641 ends the higher-low sequence". In a range it shows the two edges.
Use these rows to write down what would change your view of the chart. They are reference points for your plan, not entries or targets.
4. Similar past windows
This row summarizes how past windows in your own history that looked like the current one turned out, for example "In your history: 14 continued · 9 reversed · 9 sideways (32 windows)". Click View to open them in Similar Patterns and see each match. It describes past behavior in your data, not a forecast.
5. AI explanation
Click Explain with AI to get the facts above in plain words. The explanation follows the app language and shows which provider and model wrote it. If no AI is connected, the screen still shows every fact. You can connect one later.
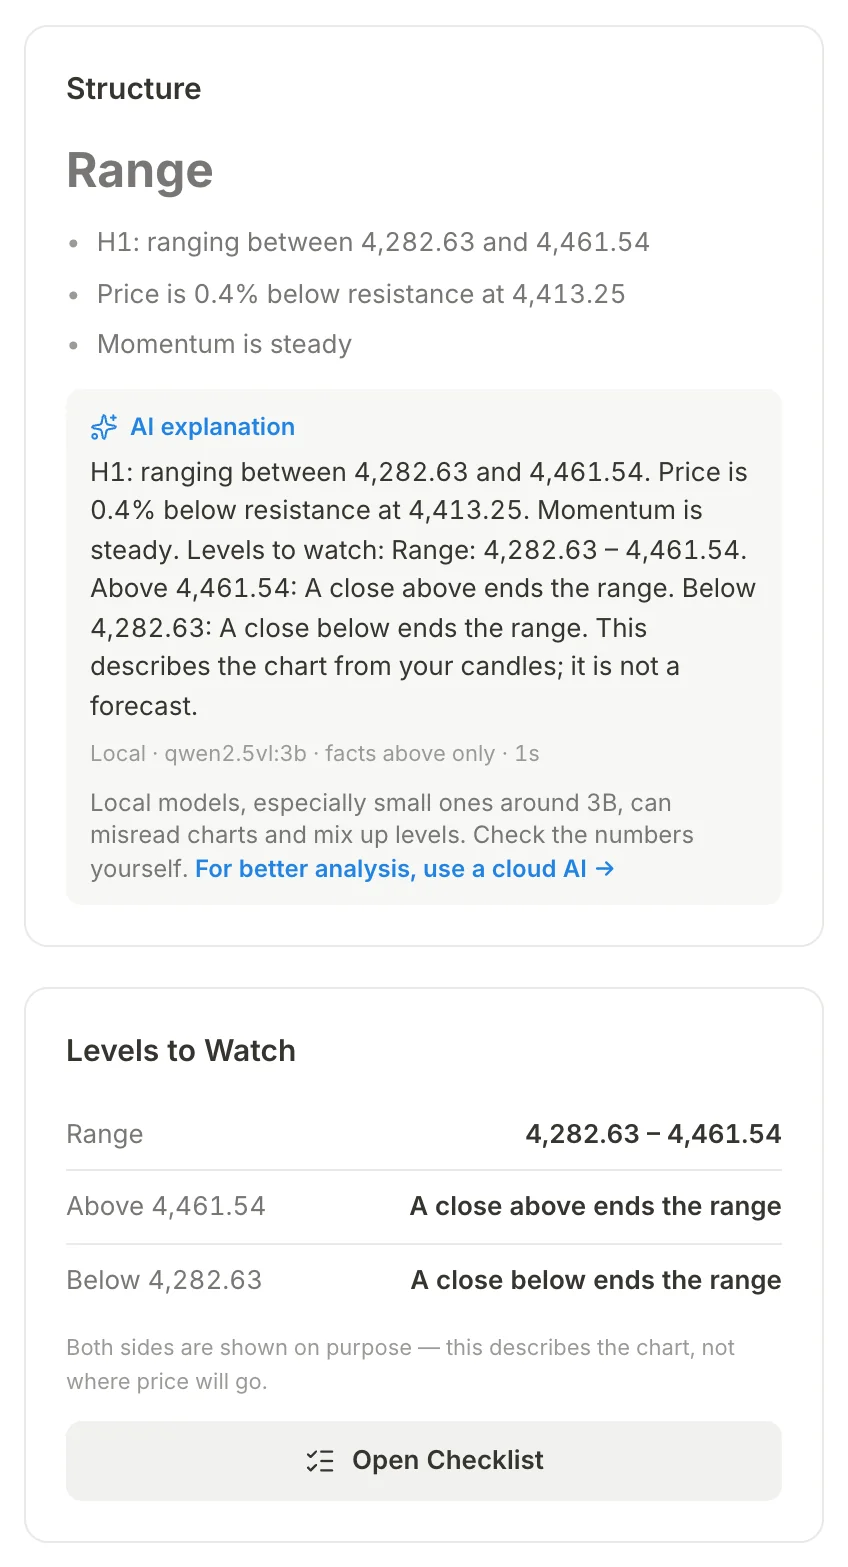
Model-generated wording can still be wrong. Compare every number in the explanation with the Structure and Levels to Watch panels, which remain the source.
6. Open Checklist
When you have read the chart, Open Checklist takes you to your pre-trade checklist. The analysis helps you describe the chart. Your rules decide whether you trade.
Connect an AI provider
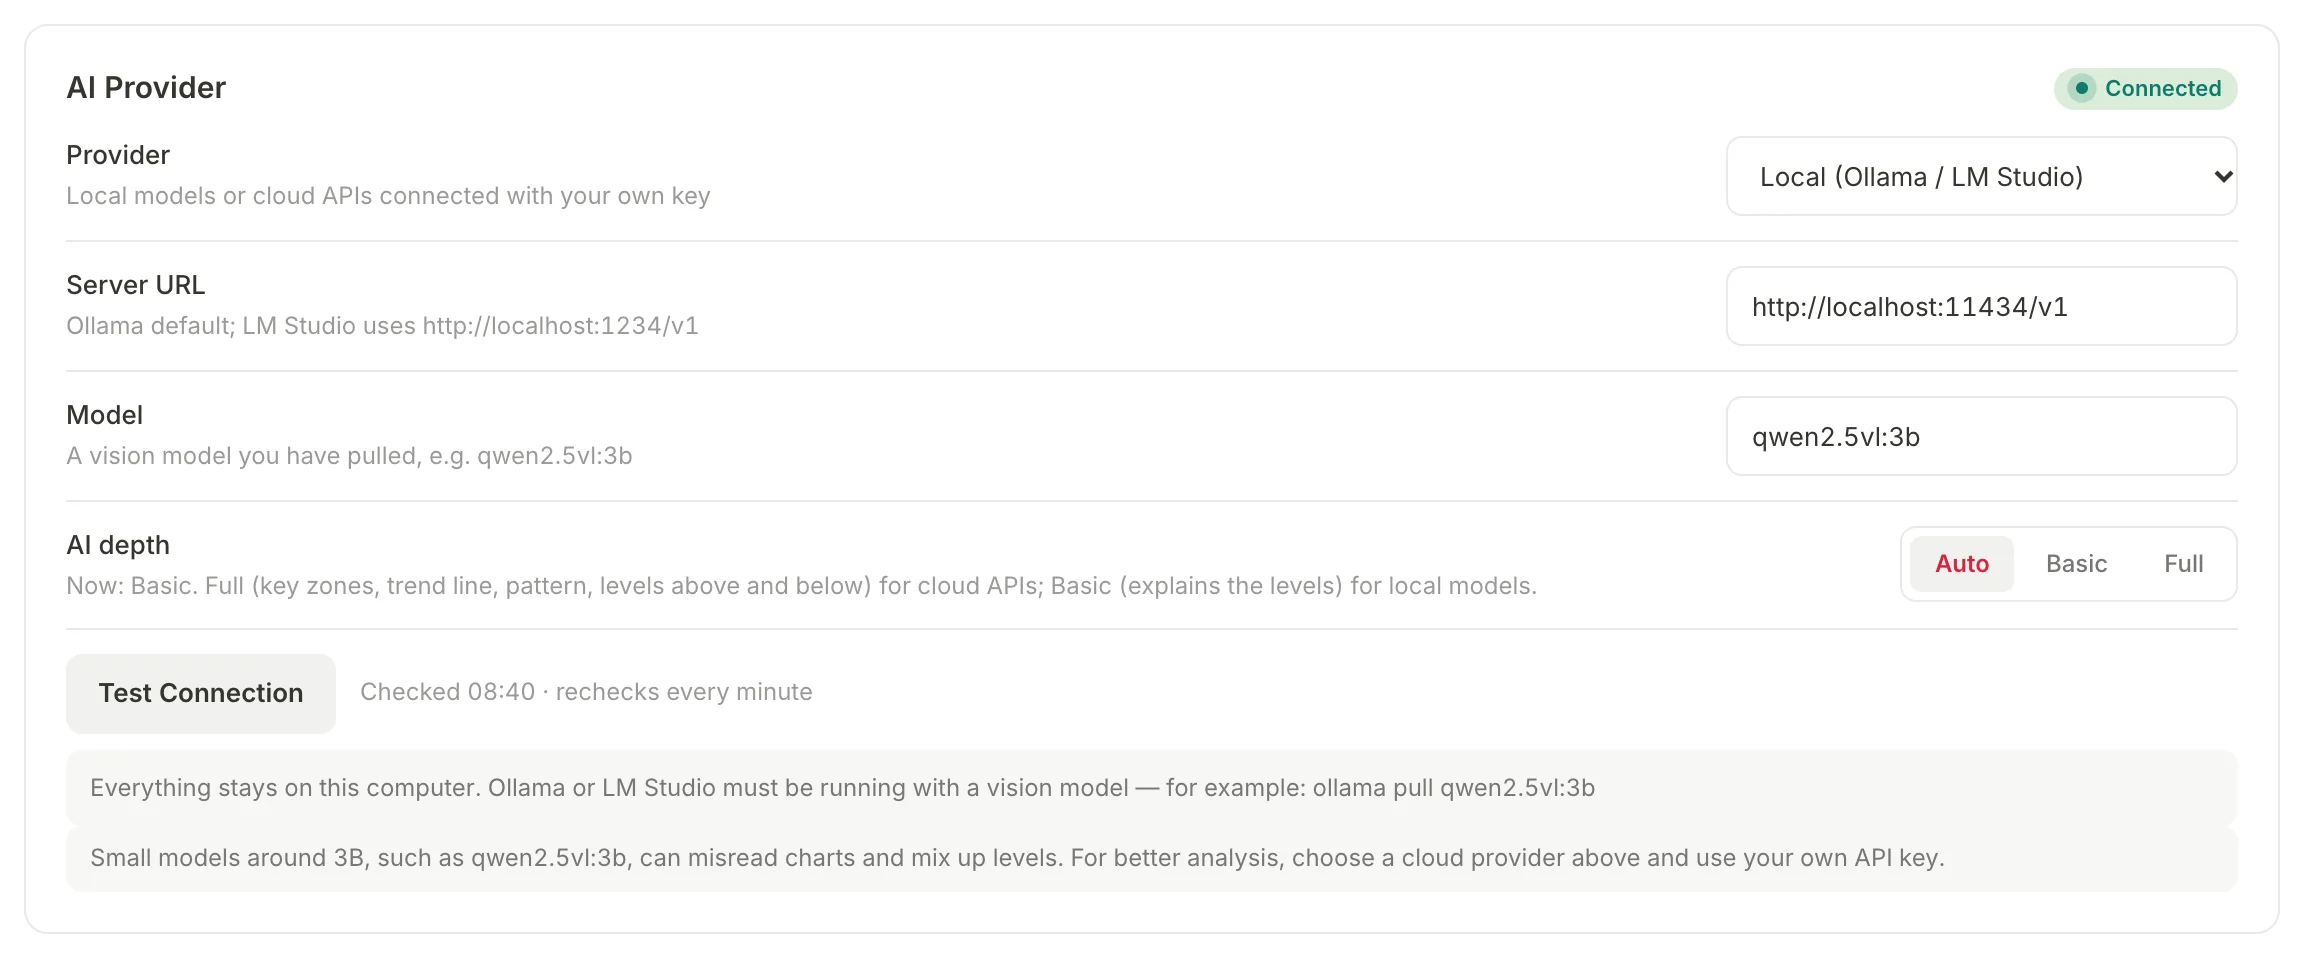
Open Settings → AI Provider and choose a Provider.
| Option | Cost | Where the facts go | Quality |
|---|---|---|---|
| Local (Ollama or LM Studio) | Free | Stays on your computer | Small models around 3B can mix up levels |
| ChatGPT, Gemini or OpenAI-compatible | Your own API usage | To the provider you chose | Better explanations |
| Anthropic (Claude) | Your own API usage | To Anthropic | Better explanations |
Enter the model and, for cloud providers, your API key, then click Test Connection. API keys are stored in your computer's keychain, never in the app database. The full steps are in Connect an AI provider.
Review a past trade with Choose Screenshot
Click Choose Screenshot and pick a chart from your Timeline. AI Analysis then reads the candles at the time of that screenshot, so you see the structure and levels as they were when you made the decision, not as they look now.
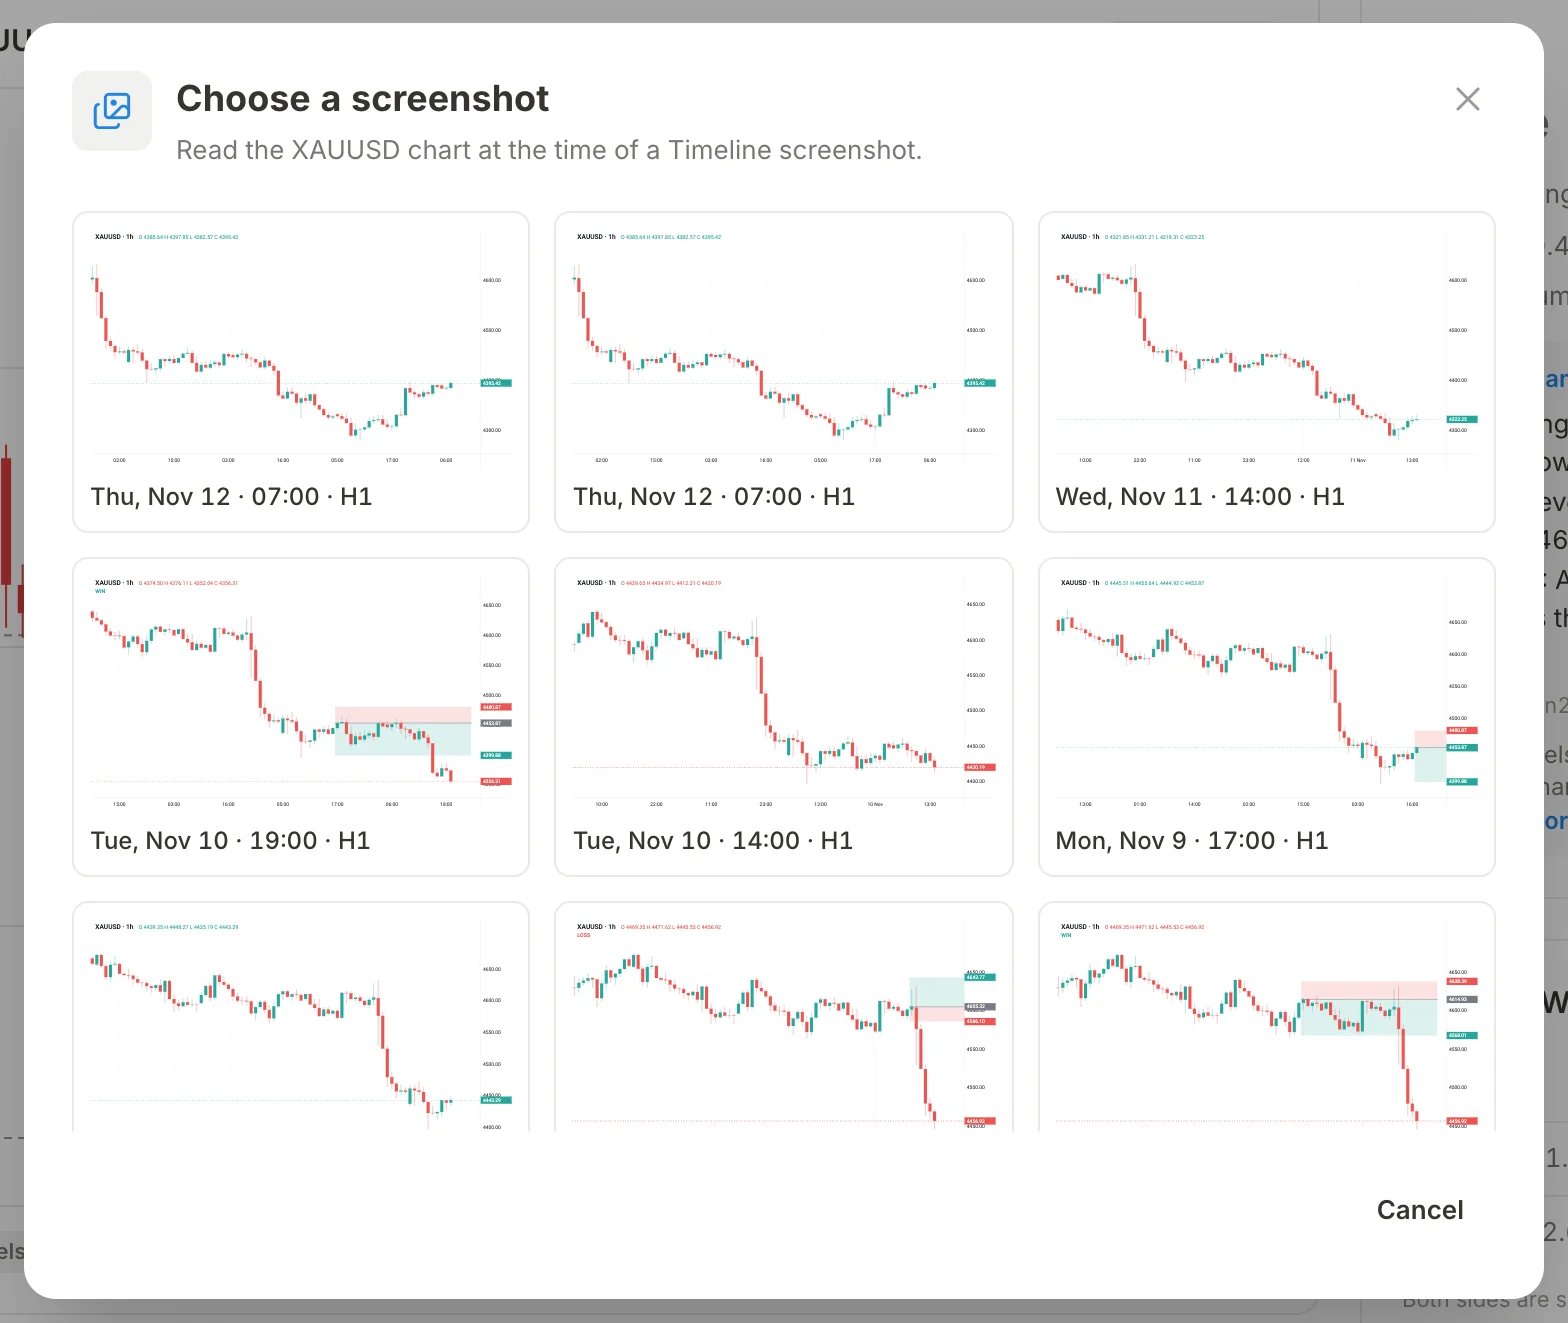
Your candles need to cover that moment. If they don't, a notice tells you which candles to import. When the candles stop shortly before the screenshot, the read uses the last candle you have and leaves out similar patterns.
For a short routine to record what you see after the review, read AI forex chart review for your trading journal.
Avoid these common mistakes
- Treating the explanation as a signal. The AI explains measured facts. It is instructed never to call a direction or give entries, stops or targets.
- Skipping the numbers. If a level in the explanation doesn't match Levels to Watch, trust the panel.
- Reading old candles as today's chart. Import fresh candles before a session.
- Expecting a small local model to read like a cloud model. It is free and private, but check its wording carefully.
- Using it after you entered. Read the chart before your checklist, not to justify a trade you already took.
Key takeaways
- AI Analysis measures structure and levels from your MT5 candles. The AI only explains them.
- Import H1 and H4 for the pair you trade, and pick one pair.
- Read Structure, then Levels to Watch, then Similar past windows, then the AI explanation.
- On this screen the AI receives the measured facts as text, not your screenshots.
- Use Choose Screenshot to review a past trade at the moment you took it.
- The checklist and your rules make the trading decision.
Try it in Red Candle
Keep your checklist, daily limits and trading journal together on your computer.
Download AppContinue in the docs
AI Analysis →Connect an AI provider →Import candles →ⓘ Educational content, not financial advice. Trading involves risk, and past results don't guarantee future results.
Related articles

AI Forex Chart Review for Your Trading Journal
Review an MT5 chart with AI, check the explanation against the candles, and record your own observations in a trading journal.
Read article →
How to Use Similar Patterns the Right Way
Set up Similar Patterns in Red Candle, choose settings that fit how you trade, and read matches, outcomes and drawdown without overreading them.
Read article →How to export candles from MetaTrader 5
How to use Export Bars in MT5, which timeframes to choose, how much history you need, and why broker server time matters.
Read article →Install Ollama and a Local LLM on macOS and Windows
Step by step guide to install Ollama, download a local AI model on Mac or Windows, test it, and connect it to your trading journal for free.
Read article →